Interactive Maps
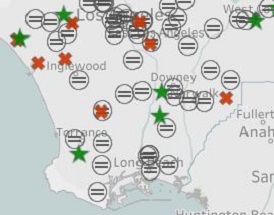
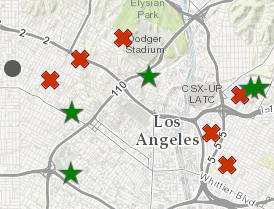
Healthcare-associated infections (HAI) occur as an unintended result during patient care. Public reporting of HAI data allows Californians to assess the quality of care in hospitals. The map provides HAI data for five infection types of HAI from all California acute care hospitals.

Health care providers (HCP) in hospitals should receive annual influenza (flu) vaccination to protect their patients, their families, and others in the community. HCP flu vaccination rates are an important measure of a hospital’s health care quality. The map shows HCP flu vaccination rates reported by California hospitals for the 2021–22 flu season.

Please share your comments or questions by e-mail us at
HAIProgram@cdph.ca.gov